요약
컨테이너 환경에서 여러 유형의 장애가 발생할 때, Health Check를 구현하여 자동으로 장애에 대응할 수 있는 방법을 연구한 결과를 공유하고 인사이트를 전달합니다.
시작하며
클라우드 네이티브 환경에서 서비스의 안정성과 가용성을 지키는 일은 단순히 서버를 띄워두는 것만으로는 충분하지 않습니다. 애플리케이션은 언제든 다양한 이유로 정상 동작을 멈출 수 있고, 컨테이너 역시 오류 상태에 빠질 수 있습니다. 그렇다면 우리는 어떻게 이러한 상황을 감지하고, 사용자가 불편을 느끼기 전에 자동으로 대응할 수 있을까요? 그 출발점이 바로 Health Check입니다.
Health Check는 무엇이고 왜 필요한가?
Health Check는 애플리케이션이 정상적으로 서비스를 제공할 수 있는지를 주기적으로 확인하는 메커니즘입니다. 예를 들어 데이터베이스 연결이 되지 않거나(Node.js 이벤트 루프가 무한 대기 상태에 빠질 수 있음), JVM 힙 메모리가 과도하게 사용되거나(Python 등에서도 메모리 누수 발생 가능), 혹은 잘못된 환경 변수 설정으로 기동 직후 종료되는 경우를 떠올려볼 수 있습니다. 실행 바이너리나 스크립트 같은 필수 자원이 누락되었거나 권한 문제로 인해 실행조차 되지 못하는 경우도 있고, 외부 서비스 장애 때문에 요청을 처리하지 못할 수도 있습니다.
컨테이너 레벨에서 대표적인 장애 상황은 다음과 같습니다.
- CrashLoopBackOff : 애플리케이션이 반복적으로 exit(1) 하는 경우
- OOMKilled : 메모리 부족으로 종료된 경우
- Error : 기동 후 실행 오류 등
- ImagePullBackOff / ErrImagePull : 이미지를 가져올 수 없거나 존재하지 않는 경우
심지어 컨테이너가 “Running” 상태라 하더라도, 애플리케이션이 500이나 503 같은 에러 응답을 지속적으로 내보내는 상황도 장애 상황이 됩니다.
이런 상황에서 Health Check는 단순히 “죽었는지 살았는지”를 확인하는 것에 그치지 않습니다. 데이터베이스 연결 실패라면 단순 종료가 아니라 재연결을 시도할 수 있고, 외부 서비스 장애라면 바로 종료하기보다는 대기하면서 복구되기를 기다릴 수 있습니다. 일시적인 메모리 스파이크로 OOM이 발생한 경우라면 재시작만으로도 충분히 복구가 가능합니다. 초기 기동 지연이 있는 경우에는 Health Check가 완료될 때까지 트래픽 유입을 막아 서비스 안정성을 확보할 수 있습니다.
Kubernetes 환경에서는 이러한 Health Check가 자동화된 장애 대응의 핵심 역할을 합니다. K8s는 컨테이너 상태를 감지해 재시작하거나 트래픽 라우팅을 차단함으로써 운영자의 수동 개입 없이도 서비스 연속성을 유지할 수 있습니다. 다만, 이미지 자체에 문제가 있거나 레지스트리 인증 오류, 권한 오류 같은 경우에는 Health Check로 감지는 가능해도 자동 복구까지는 어렵기 때문에, 초기 배포 단계에서는 여전히 모니터링이 필요합니다.
Health Check로 장애 대응 자동화를 구축하여 서비스 가용성 향상 가능
결국 Health Check는 단순한 상태 점검 도구가 아니라, 장애 발생 시 자동으로 대응하여 서비스 가용성을 높이는 기반 기술입니다. 클라우드 네이티브로 전환하는 모든 서비스에서 반드시 구현해야 하는 필수 요소이며, 안정적인 서비스 운영의 출발점이라 할 수 있습니다.
1. Health Check Strategy in Kubernetes
Health Check에 사용 가능한 Probe 종류
Kubernetes에서 안정적인 서비스를 운영하기 위해서는 단순히 Pod를 띄우는 것만으로는 충분하지 않습니다.
서비스가 실제로 정상 동작 가능한지, 그리고 트래픽을 받을 준비가 되었는지, 혹은 비정상 상태라서 재시작해야 하는지를 자동으로 감지하는 체계가 필요합니다.
Kubernetes는 이를 위해 세 가지 Probe를 제공합니다. 바로 Readiness Probe, Liveness Probe, Startup Probe입니다.
각 Probe의 개념, 역할, 동작 방식, 그리고 실무 예제를 정리해 보겠습니다. (📖 참고: Pod Lifecycle)
1.1. Liveness Probe
| 컨셉 | “이 컨테이너는 더 이상 정상적으로 동작할 수 없는 상태인가?” |
| 역할 | ㆍ컨테이너 재시작 트리거 (Restart trigger) ㆍProbe가 실패하면 kubelet이 컨테이너를 종료(kill) 시키고, restartPolicy에 따라 재시작합니다. restartPolicy 옵션 ㆍAlways (기본값): 항상 재시작 ㆍOnFailure : 실패했을 때만 재시작 |
| 동작 결과 | ㆍHealthy → 컨테이너 유지 ㆍUnhealthy → 컨테이너 kill & restart |
| 예시 | ㆍDeadlock 상태 감지 (이벤트 루프가 멈춘 경우) ㆍ내부 데이터 손상 등 복구 불가능한 오류 |
1.2. Readiness Probe
| 컨셉 | “지금 이 컨테이너가 클라이언트의 트래픽을 받아 처리할 수 있는 상태인가?” |
| 역할 | ㆍ트래픽 제어 (Traffic control) ㆍ컨테이너가 아직 준비되지 않았거나 내부적으로 오류가 있어 정상 응답을 할 수 없는 경우, Endpoints에서 Pod를 제거합니다. ㆍ즉, Pod는 Running 상태일 수 있지만, Ready는 0/1로 표시되어 트래픽이 전달되지 않습니다. |
| 동작 결과 | ㆍProbe 실패 → Pod IP가 Endpoints에서 제거 → Ready 0/1 ㆍProbe 성공 → Pod가 다시 정상 상태로 복구 → Ready 1/1 |
| 예시 | ㆍ데이터베이스 연결 체크 (DB 연결이 안 되면 Ready 아님) ㆍ애플리케이션이 HTTP 503을 반환하면 트래픽 제외 |
1.3. Startup Probe
| 컨셉 | “애플리케이션이 본격적으로 시작되기 전에, 필요한 초기 준비가 끝났는가?” |
| 역할 | ㆍ초기 기동 검증 (Startup validation) ㆍStartup Probe가 성공하기 전까지는 Readiness Probe와 Liveness Probe는 동작하지 않습니다. ㆍ덕분에 초기 부팅이 오래 걸리는 애플리케이션(JVM, Spring Boot, 대형 DB 초기화 등)도 “기동 지연 때문에 Liveness Probe가 실패 → 불필요한 재시작” 같은 문제를 피할 수 있습니다. |
| 동작 결과 | ㆍ스타트업 진행 중 → 다른 Probes 대기 ㆍ스타트업 완료 → Readiness/Liveness Probe 활성화 |
| 예시 | ㆍDB Health Check (기동 직후 DB 커넥션 풀 준비 확인) ㆍJVM 구동 및 Spring Context 초기화 완료 여부 |
1.4. 정리
- Liveness Probe → 컨테이너 자체가 죽었는지 감지 후 재시작
- Readiness Probe → 트래픽을 받을 수 있는지 제어
- Startup Probe → 초기 부팅이 끝났는지 확인, 다른 Probe 작동 시점 제어
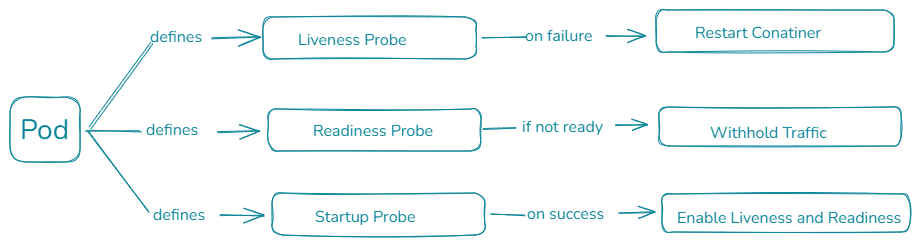
- Probes 요약
| Liveness Probe | Readiness Probe | Startup Probe | |
|---|---|---|---|
| On failure | ㆍRestart Container | ㆍStop sending traffic to Container | ㆍRestart Container |
| Check types | ㆍHttp ㆍExec ㆍtcpSocket ㆍgRPC(Beta in Kuberbetes 1.24) | ㆍHttp ㆍExec ㆍtcpSocket ㆍgRPC(Beta in Kuberbetes 1.24) | ㆍHttp ㆍExec ㆍtcpSocket ㆍgRPC(Beta in Kuberbetes 1.24) |
출처 – Kubernetes 에서 Pod 에 대한 헬스체크 (probe)
Kubernetes에서 Health Check는 단순히 상태 확인을 넘어서, 서비스 가용성을 보장하고 장애 자동 복구를 가능하게 하는 핵심 메커니즘입니다. 각 Probe를 상황에 맞게 잘 조합하면, 예상치 못한 장애 상황에서도 서비스의 안정성을 크게 높일 수 있습니다.
2. Probe Check Method
Kubernetes의 Probe는 단순히 “있다/없다”를 확인하는 게 아니라, 컨테이너 내부 애플리케이션이 정상적으로 동작 중인지를 판단하기 위한 다양한 방법을 제공합니다. 어떤 방법을 선택하느냐에 따라 성능, 구현 난이도, 적용 가능한 서비스 유형이 달라지므로 각 Probe Check Method의 특징을 이해하는 것이 중요합니다.
2.1. HTTP Get
가장 흔히 쓰이는 방식입니다.
| 원리 | 지정된 HTTP Endpoint를 주기적으로 호출해서 응답 상태 코드를 확인합니다. ㆍ200 ~ 399 → Success ㆍ그 외 (400, 500, 503 등) → Fail |
| 적용 상황 | HTTP API를 제공하는 대부분의 애플리케이션에서 바로 적용할 수 있습니다. |
| 예시 | ㆍNode.js: Express 앱에 /health 관련 엔드 포인트 추가 ㆍPython: Flask, FastAPI, Django에서 /health 관련 라우트 구현 ㆍC++: cpp-httplib(백그라운드 스레드), Boost.Beast, Crow 같은 라이브러리로 HTTP 서버 열고 상태 반환 ㆍJava: Spring Boot Actuator의 /actuator/health, MicroProfile Health를 지원하는 Jakarta 계열 프레임워크 Quarkus / Open Liberty / Payara Micro 에서 health 관련 구현 |
이 방법의 장점은 간단하면서도 트래픽 경로와 동일한 방식으로 상태를 검증할 수 있다는 것입니다.
2.2. Exec
HTTP 서버를 직접 띄우지 않는 앱이라면 exec 방식이 더 적합합니다.
| 원리 | 컨테이너 내부에서 지정된 명령어 또는 스크립트를 실행합니다. ㆍ리턴값 0 → Success ㆍ그 외 → Fail |
| 적용 상황 | ㆍCLI 기반 애플리케이션 ㆍHTTP Endpoint를 제공하지 않는 서비스 |
| 주의사항 | 매번 새로운 프로세스를 포크(fork) 해야 하므로, 체크 주기가 짧으면 부하가 발생할 수 있습니다. 따라서 단순한 쉘 스크립트 정도로 가볍게 상태를 점검하는 방식이 권장됩니다. |
예를 들어 데이터 파일 유효성, 특정 포트 열림 여부, 내부 프로세스 상태 등을 exec로 점검할 수 있습니다.
2.3. TCP Socket
이 방식은 단순히 TCP 포트에 연결 가능한지를 확인합니다.
| 원리 | 특정 포트에 TCP handshake가 성공하면 Success, 실패하면 Fail |
| 적용 상황 | ㆍ자체 프로토콜을 쓰는 서버 (예: Redis, MySQL, Kafka, gRPC 등) ㆍHTTP처럼 응답 코드를 직접 확인할 필요가 없고, 단순히 “열려 있는지”만 보면 되는 경우 |
| 단점 | 애플리케이션 로직까지는 검증하지 못한다는 단점이 있습니다. TCP 레벨에서 연결만 된다면 “정상”으로 간주하기 때문에, 실제 애플리케이션이 에러를 내고 있어도 감지하지 못할 수 있습니다. |
tcpSocket은 사용하지 않는 것을 권장합니다.
2.4. gRPC
Kubernetes 1.23부터 정식 지원된 gRPC Health Check 방식입니다.
| 원리 | gRPC 서버에 Health Check 서비스를 호출하여 결과를 확인합니다. |
| 적용 상황 | ㆍgRPC를 사용하는 애플리케이션 (특히 마이크로 서비스 아키텍처, MSA) ㆍHTTP 엔드 포인트를 별도로 열고 싶지 않은 경우 |
gRPC 기반 서비스라면 httpGet 대신 gRPC Probe를 쓰는 것이 자연스럽고, 표준 Health Check 프로토콜을 따르므로 확장성도 좋습니다.
2.5. Probe Options
Probe는 단순히 방법만 선택하는 것이 아니라, 시간 제어 옵션을 통해 좀 더 세밀하게 조정할 수 있습니다.
시간 제어 옵션
failure time = periodSeconds * failureThreshold
- periodSeconds: 체크 주기 (기본 10초)
- failureThreshold: 연속 실패 횟수 (기본 3회)
여기서 실패 시간은 10초 * 3회 = 30초이며, Probe가 완전히 실패로 간주되기까지 걸리는 시간을 의미합니다.
Probe Options을 어떻게 설정하느냐에 따라 “장애 감지 속도 vs. 불필요한 재시작 방지” 사이의 균형을 맞출 수 있습니다.
설정 가능한 옵션과 기본값은 아래와 같습니다.
| Parameter | Description | Default |
|---|---|---|
| initialDelaySeconds | 컨테이너가 시작된 후 Probe가 실행되기 전, 대기 시간으로 애플리케이션 초기화 시간을 보장하기 위해 설정 | 0 |
| periodSeconds | ㆍProbe 실행 주기(단위: 초) ㆍ얼마나 자주 상태 검사를 수행할지 결정 | 10 |
| timeoutSeconds | ㆍProbe 응답을 기다리는 최대 시간(단위: 초) ㆍ지정 시간 내 응답이 없으면 실패로 간주 | 1 |
| successThreshold | Probe 결과가 “성공”으로 전환되기 위해 필요한 연속 성공 횟수 | 1 |
| failureThreshold | Probe 결과가 “실패”로 전환되기 위해 필요한 연속 실패 횟수 | 3 |
출처 – Kubernetes Readiness Probe: Guide & Examples
2.6. 정리
| Probe Check Method | 특징 |
|---|---|
| httpGet | 웹 애플리케이션에 가장 적합 |
| exec | CLI 앱이나 HTTP 없는 서비스에서 사용 |
| tcpSocket | TCP 연결만 확인하면 충분한 경우 |
| gRPC | gRPC 서비스 전용, 최신 Kubernetes에서 활용 가능 |
| Probe Options | 감지 속도와 안정성의 균형을 조정 |
Probe는 단순한 옵션 같지만, 실제 운영 환경에서는 서비스 성격에 맞는 방식을 고르고 올바른 주기/임곗값을 설정하는 것이 장애 대응 효율성과 서비스 가용성에 직결됩니다.
3. Container Lifecycle과 Probes
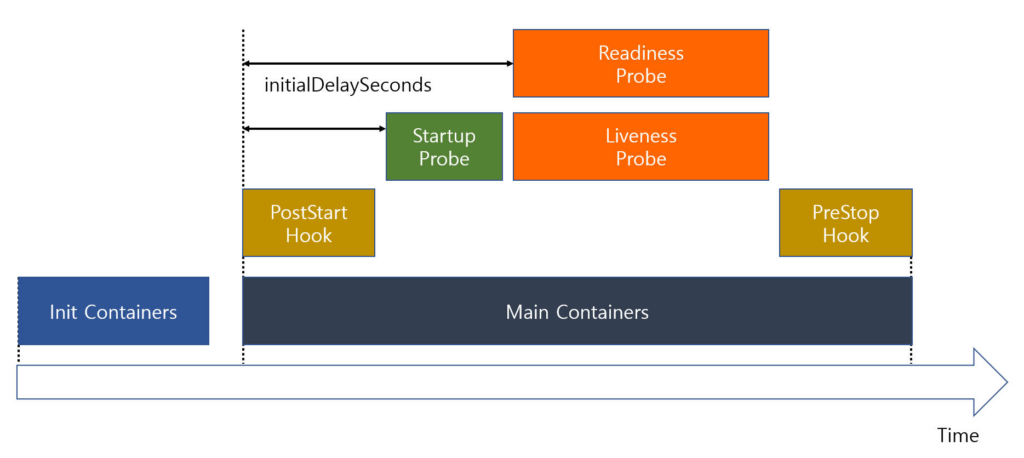
Kubernetes에서 컨테이너는 단순히 시작하고 종료되는 게 아니라, 여러 Hook과 Probe를 거치며 동작합니다.
- Pod가 실행되면 먼저 Init Container가 선행 작업을 처리합니다.
- 이후 메인 컨테이너가 올라오면서 PostStart Hook가 실행되고, 애플리케이션이 준비될 때까지 Startup Probe가 기다려줍니다.
- 이후 PostStart Hook가 완료되면 Startup Probe가 시작됩니다.
- Startup Probe가 완료되면(컨테이너가 정상적으로 올라오면) Readiness Probe가 트래픽을 받을 준비 여부를 확인하고, Liveness Probe는 주기적으로 컨테이너가 살아 있는지를 체크해 문제가 생기면 재시작을 유도합니다.
- 종료 시점에는 PreStop Hook가 실행되어 연결을 정리하거나 종료 절차를 마무리할 수 있습니다.
즉, 컨테이너 수명주기 전반에 걸쳐 Probe와 Hook가 적절히 배치되어 있어야 애플리케이션이 안정적으로 기동하고, 운영되고, 종료될 수 있습니다.
간단한 YAML 로 생명 주기 확인하기
apiVersion: v1
kind: Pod
metadata:
  name: probe-example
spec:
  initContainers:
    - name: init-db
      image: busybox
      command: ['sh', '-c', 'echo waiting for db... && sleep 5']

  containers:
    - name: app
      image: my-app:latest
      lifecycle:
        postStart:
          exec:
            command: ["sh", "-c", "echo PostStart hook executed"]
        preStop:
          exec:
            command: ["sh", "-c", "echo PreStop hook executed"]
      startupProbe:
        httpGet:
          path: /health/startz
          port: 8080
        failureThreshold: 6
        periodSeconds: 10
      readinessProbe:
        httpGet:
          path: /health/readyz
          port: 8080
        initialDelaySeconds: 10
        failureThreshold: 3
        periodSeconds: 10
      livenessProbe:
        httpGet:
          path: /health/livez
          port: 8080
        initialDelaySeconds: 10
        failureThreshold: 3
        periodSeconds: 10
4. Probe 구현 사례
4.1. initialDelaySeconds vs. Startup Probe
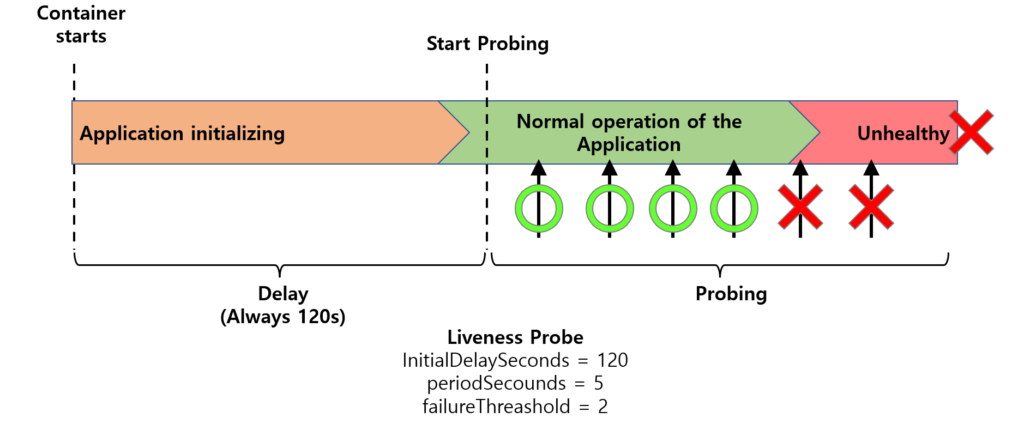
initialDelaySeconds는 컨테이너가 시작된 직후부터 지정된 시간만큼 기다렸다가 Probe를 시작하도록 설정하는 옵션입니다.
예를 들어, initialDelaySeconds: 120으로 설정하면 애플리케이션이 기동 후 항상 120초가 지난 다음부터 Probe가 시작됩니다.
이 방식은 간단하지만, 애플리케이션이 더 빨리 준비되었더라도 무조건 대기 시간이 고정된다는 단점이 있습니다.
Startup Probe를 사용하면 애플리케이션의 실제 초기화 완료 여부를 동적으로 감지할 수 있습니다.
즉, 준비가 끝나는 즉시 다음 Probe(Liveness/Readiness) 검사를 시작할 수 있으며, 최대 120초까지 기다린다는 점에서 더 유연합니다.
이 방식은 애플리케이션 초기화가 오래 걸릴 수 있는 환경에서 특히 유용하며, 초기 지연 시간을 최적화할 수 있습니다.
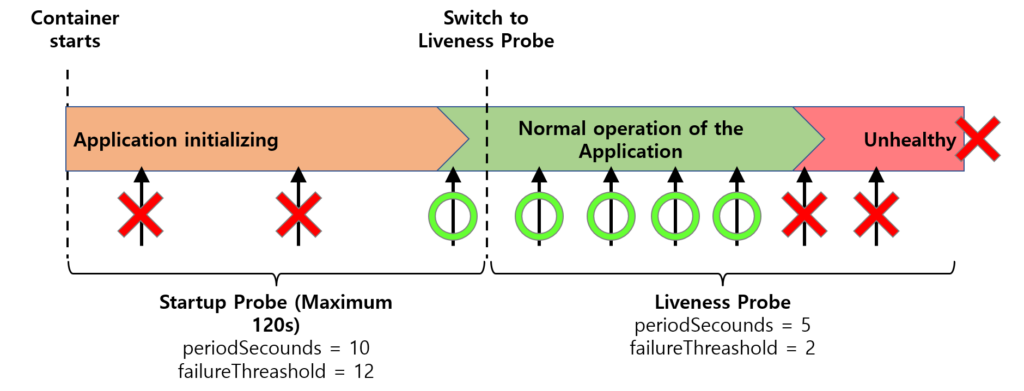
Startup Probe를 구현하면 initialDelaySeconds는 0 또는 아주 짧게 설정해도 됩니다. 왜냐하면 Startup Probe가 완료되기 전에는 다른 Probe들이 시작되지 않기 때문입니다.
4.2. Pod Scale Strategy by Health Check
4.2.1. Health Check로 Pod를 확장할 수 있을까?
일반적으로 Pod 스케일을 위한 메트릭은 CPU와 메모리 사용량입니다. 그 외에 다른 항목들, 예를 들어 프로세스 수, Queue 길이 등을 추가해 주면 더 정교한 스케일이 가능할 것입니다. Probe에서 프로세스 수, Queue 길이 등은 충분히 검사할 수 있는 정보들입니다. 이 정보를 스케일을 위한 메트릭으로 전달해 주면 Pod를 확장할 수 있지 않을까 싶습니다.
그러나 Probe 작동 방식으로 인해 Kubernetes의 확장 메트릭(HPA)까지 직접 반영되지는 않습니다.
- Startup Probe: 초기 기동 상태만 알려줌
- Liveness Probe: 재시작이 필요한 상황만 알려줌
- Readiness Probe: 트래픽을 받을 수 있는지 여부만 알려줌
즉, Probe의 최종 결과는 이진 값으로 컨테이너 축소(줄이는 상황)에 대한 판단에는 유효하지만, 확장(늘리는 상황)에는 충분하지 않습니다.
4.2.2. HPA(Horizontal Pod Autoscaler)와 Health Check
HPA는 단순 성공/실패 이진 값으로는 스케일링 결정을 내릴 수 없습니다.
Pod 확장을 위해서는 컨테이너가 얼마나 바쁜지에 대한 정량적 지표가 필요합니다.
결과적으로, Health Check는 안정적인 운영에 필수적이지만, Pod 확장을 위한 Metric으로는 의미가 없습니다. 이 경우 Custom Metric을 직접 구현하여 HPA와 연동하는 것이 필요합니다.
4.3. Health Check with GraphQL
컨테이너 환경에서 서비스의 상태를 효율적으로 감시하기 위해 Health Check를 구현하는 방법은 다양합니다. 그중 GraphQL을 활용하면 REST API를 일원화하고, 입력·응답을 표준화하여 단일한 방식으로 상태 확인이 가능합니다. 이번에는 Python Graphene 기반 GraphQL 예제를 통해 Health Check 구현 방법을 살펴보겠습니다.
4.3.1. Python Graphene 예제
“health 쿼리”에 대응하는 resolver를 구현했습니다. resolver 안에 필요한 검사를 추가 구현해 줄 수 있습니다.
import graphene

class Health(graphene.ObjectType):
    # Liveness check
    liveness = graphene.String()
    def resolve_liveness(self, info):
        return "alive"

    # Readiness check
    readiness = graphene.String()
    def resolve_readiness(self, info):
        try:
            db_connection.ping()
        except Exception:
            raise Exception("Database connection failed")
        return "ready"

    # Startup check
    startup = graphene.String()
    def resolve_startup(self, info):
        # Check here
        return "complete"

class Query(graphene.ObjectType):
    probes = graphene.Field(Probes)
    def resolve_health(self, info):
        return Health()

schema = graphene.Schema(query=Query)
4.3.2. 쿼리와 응답 예시
① Liveness Probe
query Liveness {
  health { liveness }
}
{
"data": {
"health": {
"liveness": "alive"
}
}
}② Readiness Probe
query Readiness {
  health { readiness }
}
{
"data": {
"health": {
"readiness": "ready"
}
}
}③ Startup Probe
query Startup {
  health { startup }
}
{
"data": {
"health": {
"startup": "complete"
}
}
}즉, GraphQL 응답에서 alive, ready, complete를 받으면 정상 상태이며, 그 외 값은 비정상 상태로 간주할 수 있습니다. 그럼 이렇게 쓰기만 하면 되는 걸까요?
4.3.3. Kubernetes 적용 문제
GraphQL 기반 Health Check는 이론적으로는 깔끔해 보이지만, Kubernetes에 바로 적용하기에는 제약이 있습니다.
- 문제: Kubernetes Probe 호출 방식
- K8s는 보통 httpGet으로 단순한 엔드포인트를 호출해 상태를 확인합니다.
- 하지만 GraphQL은 POST 요청을 통해 query를 전달해야 하므로 httpGet을 그대로 사용할 수 없습니다.
- 대안: exec 방식 활용
- 대신 exec로 curl을 실행해 POST 요청을 보내고, jq로 응답을 파싱 하는 방식이 필요합니다.
startupProbe:
  exec:
    command:
    - /bin/sh
    - -c
    - |
      curl -s -X POST -H 'Content-Type: application/json' \
      -d '{"query": "{ health { startup } }"}' \
      http://localhost:5000/graphql \
      | jq -e '.data.health.startup == "complete"' > /dev/null
  periodSeconds: 5
  failureThreshold: 3

livenessProbe:
  exec:
    command:
    - /bin/sh
    - -c
    - |
      curl -s -X POST -H 'Content-Type: application/json' \
      -d '{"query": "{ health { liveness } }"}' \
      http://localhost:5000/graphql \
      | jq -e '.data.health.liveness == "alive"' > /dev/null
  periodSeconds: 5
  failureThreshold: 3

readinessProbe:
  exec:
    command:
    - /bin/sh
    - -c
    - |
      curl -s -X POST -H 'Content-Type: application/json' \
      -d '{"query": "{ health { readiness } }"}' \
      http://localhost:5000/graphql \
      | jq -e '.data.health.readiness == "ready"' > /dev/null
  periodSeconds: 5
failureThreshold: 3- 한계와 고려 사항
- exec는 추가적인 프로세스 fork 부하를 발생시킵니다.
- 그 안에서 curl 실행 → HTTP 요청 처리 → GraphQL 파싱까지 이어지면 비용이 커집니다.
- GraphQL은 구조상 httpGet보다 무겁고 구현 난도도 높습니다.
따라서, HTTP 통신이 가능하다면 GraphQL보다는 단순한 httpGet endpoint를 구현하는 것이 Kubernetes 환경에 최적화된 접근 방법입니다.
5. Probe API 개발 시 유의사항
Kubernetes에서 Probe는 컨테이너 상태를 감지하는 핵심 메커니즘입니다. 하지만 무심코 작성한 Probe가 오히려 서비스 성능을 저해하거나 불필요한 부하를 유발할 수 있습니다. Probe는 단순히 “살아있다/준비됐다”를 확인하는 역할에 집중해야 하며, 효율적으로 설계하는 것이 무엇보다 중요합니다.
5.1. Make Probe Lightweight !!
특히 Startup Probe를 제외한 Liveness Probe, Readiness Probe는 매우 짧은 주기로 호출됩니다. 예를 들어 periodSeconds : 5로 설정하면 1분 동안 12번, 1시간이면 720번 호출됩니다. 이처럼 자주 실행되기 때문에 Probe는 가볍고 빠르게 동작해야 합니다.
5.2. HTTP Get을 최우선으로 선택
Probe 구현 방식 중 가장 권장되는 방법은 httpGet입니다.
- 컨테이너 내부에서 추가적인 프로세스를 생성하지 않습니다.
- 구현이 단순하고, 애플리케이션 서버가 이미 HTTP 엔드 포인트를 제공한다면 곧바로 활용 가능합니다.
- 불필요한 로직을 최소화한 단순한 응답만을 반환하면 됩니다.
livenessProbe:
  httpGet:
    path: /livez
    port: 8080
  periodSeconds: 5
  failureThreshold: 3
5.3. DB 쿼리 호출은 피하자
Health Check 전용 Probe에서 DB 연결과 쿼리 실행을 매번 수행하는 것은 피해야 합니다.
- DB 커넥션 생성 비용이 크고, 매번 연결 요청을 보내면 데이터베이스에 불필요한 부하를 줍니다.
- 단순히 애플리케이션이 살아 있는지 확인하는 Probe라면 이런 검사는 과합니다.
- DB 상태 검증은 애플리케이션 내부 로직에서 주기적으로 수행하고, Probe에서는 그 결과만 활용하는 편이 좋습니다.
5.4. Probe 전용 Endpoint 분리
하나의 엔드 포인트(/health)에 모든 검증 로직을 몰아넣기보다는, Probe 종류별 전용 엔드 포인트를 두는 것이 이상적입니다.
- /livez : Liveness Probe
- /readyz : Readiness Probe
- /startz : Startup Probe
각 Probe는 역할이 다르므로 필요한 최소한의 검사만 수행하도록 합니다. 예를 들어 웹서버의 Liveness는 단순히 웹 페이지가 서비스 중인지 확인하는 수준이면 충분합니다.
5.5. Flag & File 검사 활용
Probe에서 꼭 외부 서비스 호출이나 복잡한 연산을 할 필요는 없습니다. 간단한 Flag 값이나 파일 존재 여부로도 충분히 상태를 확인할 수 있습니다.
- 정상 상태일 때 App에서 특정 파일 생성 : touch /tmp/readyz
- 비정상 상태일 때 App에서 특정 파일 삭제 : rm /tmp/readyz
- Probe에서는 특정 파일의 존재 여부만 확인 : test -f /tmp/readyz
이 방식은 CPU나 메모리 사용량이 거의 없으며, 빠르고 안정적입니다.
5.3.에서 언급한 것처럼 App 단에서 검증 로직을 수행하고, 여기서 Flag 또는 File을 설정해 주고, Probe에서는 이에 대한 검사만 수행하는 것이 가장 좋은 선택입니다.
6. Probe API 개발 방법
Kubernetes에서 Liveness Probe, Readiness Probe, Startup Probe는 단순한 설정만으로 끝나지 않습니다. 실제 애플리케이션에 맞는 Probe API를 직접 구현해야 장애 감지를 안정적으로 할 수 있습니다.
이번 글에서는 Exec 방식과 HTTP Endpoint 방식 등 예제를 중심으로 Probe API 개발 방법을 정리해 보겠습니다.
6.1. Exec Method – 스크립트 실행
exec 방식은 컨테이너 내부에서 직접 명령어나 스크립트를 실행해 상태를 확인하는 방법입니다.
livenessProbe:
  exec:
    command: ["/bin/sh", "/path/to/livez.sh"]
  periodSeconds: 10
  failureThreshold: 3
여기서 livez.sh는 실행 가능한 상태여야 하므로 chmod a+x livez.sh로 권한을 주어야 합니다. 스크립트 내부에서는 원하는 대로 정밀한 검사를 구현할 수 있습니다.
스크립트 예시
#!/bin/sh

# 프로세스 실행 여부 확인
pgrep myapp > /dev/null
if [ $? -ne 0 ]; then
    exit 1   # 비정상 상태
fi

# HTTP 상태 확인
STATUS=$(curl -s -o /dev/null -w "%{http_code}" "http://localhost:8080/health")
if [ "$STATUS" -lt 200 ] || [ "$STATUS" -gt 399 ]; then
    exit 1    # 비정상 상태
fi

exit 0 # 정상 상태- exit 0 : 정상 상태
- exit 1 : 비정상 상태
이 방식은 CPU·메모리·네트워크까지 다양하게 검사할 수 있어 정밀도가 높습니다.
6.2. Exec Method – 파일 존재 여부 검사
조금 더 단순한 방법으로는 파일 존재 여부를 확인하는 방식이 있습니다.
readinessProbe:
  exec:
    command: ["test", "-f", "/path/to/readyz"]    # 파일 존재 여부 검사
  periodSeconds: 10
  failureThreshold: 3
애플리케이션에서는 상태에 따라 파일을 생성하거나 삭제하면 됩니다.
애플리케이션 예시
#!/bin/sh

# 프로세스 실행 여부 확인
pgrep myapp > /dev/null
if [ $? -ne 0 ]; then
    rm /path/to/readyz        # 비정상 상태
fi

# HTTP 상태 확인
STATUS=$(curl -s -o /dev/null -w "%{http_code}" "http://localhost:8080/health")
if [ "$STATUS" -lt 200 ] || [ "$STATUS" -gt 399 ]; then
    rm /path/to/readyz        # 비정상 상태
fi

exit touch /path/to/readyz # 정상 상태- 정상 상태일 경우 파일 생성 : touch /path/to/readyz
- 비정상 상태일 경우 파일 삭제 : rm /path/to/readyz
Probe는 단순히 파일 유무만 확인하기 때문에 부하는 거의 없습니다. 복잡한 로직 실행보다 가벼우면서도 유용하게 쓸 수 있는 방법입니다.
6.3. HTTP GET Endpoints
가장 흔히 쓰이는 방식은 HTTP API Endpoint를 따로 구현하는 것입니다. Probe마다 역할이 다르기 때문에 각각의 Endpoint를 분리하는 것이 좋습니다.
readinessProbe:
  httpGet:
    path: /readyz
    port: 8080
  periodSeconds: 10
  failureThreshold: 3

livenessProbe:
  httpGet:
    path: /livez
    port: 8080
  periodSeconds: 10
  failureThreshold: 3

startupProbe:
  httpGet:
    path: /startz
    port: 8080
  periodSeconds: 10
  failureThreshold: 3
각 Endpoint에는 해당 Probe에 맞는 검사 로직을 구현해야 합니다.
6.4. Sample Code – Node.js Express
Node.js Express를 예로 들면 다음과 같이 간단하게 Probe Endpoint를 만들 수 있습니다.
const express = require('express');
const app = express();
const port = 8080;

// Application state flags
let isStartingUp = true;
let isReady = false;

// Simulate a long startup process
setTimeout(() => {
  isStartingUp = false;
  console.log('Startup complete.');

  // Simulate it's ready
  setTimeout(() => {
    isReady = true;
    console.log('Application is now ready!');
  }, 5000); // 5sec for become ready
}, 10000); // 10sec for startup process

// Startup Probe
app.get('/startz', (req, res) => {
  if (isStartingUp) {
    res.status(503).send('Starting up..');
  } else {
    res.status(200).send('Startup complete');
  }
});

// Readiness Probe
app.get('/readyz', (req, res) => {
  if (isReady) {
    res.status(200).send('Ready');
  } else {
    res.status(503).send('Not ready');
  }
});

// Liveness Probe: Not running when server down
app.get('/livez', (req, res) => {
  res.status(200).send('Live');
});

app.get('/', (req, res) => {
  res.send('Hello from the Node.js app!');
});

app.listen(port, () => {
  console.log(`Listening on port: ${port}`);
});
6.5. Sample Code – Python FastAPI
Python에서도 FastAPI로 간단하게 Probe Endpoint를 만들 수 있습니다.
class ApplicationState:
    def __init__(self):
        self.is_starting_up = True
        self.is_ready = False
        self._lock = threading.Lock()

    def set_startup_complete(self):
        with self._lock:
            self.is_starting_up = False
            print("Startup complete.")

    def set_ready(self):
        with self._lock:
            self.is_ready = True
            print("Application is now ready!")

    def get_startup_status(self) -> bool:
        with self._lock:
            return self.is_starting_up

    def get_ready_status(self) -> bool:
        with self._lock:
            return self.is_ready
app_state = ApplicationState()

...

@app.get("/startz")
async def startup_probe(response: Response):
    """Startup probe endpoint"""
    if app_state.get_startup_status():
        response.status_code = status.HTTP_503_SERVICE_UNAVAILABLE
        return PlainTextResponse("Starting up..", status_code=503)
    else:
        return PlainTextResponse("Startup complete", status_code=200)

@app.get("/readyz")
async def readiness_probe(response: Response):
    """Readiness probe endpoint"""
    if app_state.get_ready_status():
        return PlainTextResponse("Ready", status_code=200)
    else:
        response.status_code = status.HTTP_503_SERVICE_UNAVAILABLE
        return PlainTextResponse("Not ready", status_code=503)

@app.get("/livez")
async def liveness_probe():
    """Liveness probe endpoint - always returns 200 when server is running"""
    return PlainTextResponse("Live", status_code=200)
...
6.6. Sample Code – Java Spring Boot with Actuator
Java Spring Boot에서는 Actuator 모듈이 제공되며, 이를 통해 통일성 있게 구현할 수 있습니다.
[ build.gradle ]
dependencies {
    implementation 'org.springframework.boot:spring-boot-starter-actuator'
    implementation 'org.springframework.boot:spring-boot-starter-web'
}

[ application.properties ]
# Expose only the health groups we want
management.endpoints.web.exposure.include=health

# Configure separate liveness, readiness probes
management.endpoint.health.probes.enabled=true

# Change default paths (optional, nice for K8s mapping)
management.endpoints.web.base-path=/
management.endpoint.health.group.liveness.include=livenessState
management.endpoint.health.group.readiness.include=readinessState

[ Custom Startup Probe ]
import org.springframework.boot.actuate.health.Health;
import org.springframework.boot.actuate.health.HealthIndicator;
import org.springframework.stereotype.Component;

@Component("startup")
public class StartupHealthIndicator implements HealthIndicator {
    private volatile boolean startingUp = true;

    public StartupHealthIndicator() {
        // Simulate 10sec startup before ready
        new Thread(() -> {
            try {
                Thread.sleep(10000); // 10s startup
                startingUp = false;
            } catch (InterruptedException ignored) {}
        }).start();
    }

    @Override
    public Health health() {
        if (startingUp) {
            return Health.status("STARTING_UP").withDetail("message", "Application is starting").build();
        }
        return Health.up().withDetail("message", "Startup complete").build();
    }
}

[ Custom Readiness Probe ]
import org.springframework.boot.actuate.health.Health;
import org.springframework.boot.actuate.health.HealthIndicator;
import org.springframework.stereotype.Component;

@Component("customReadiness")
public class ReadinessHealthIndicator implements HealthIndicator {
    private volatile boolean ready = false;

    public ReadinessHealthIndicator() {
        // Simulate: ready 5sec after startup
        new Thread(() -> {
            try {
                Thread.sleep(15000); // 10s startup + 5sec extra
                ready = true;
            } catch (InterruptedException ignored) {}
        }).start();
    }

    @Override
    public Health health() {
        if (ready) {
            return Health.up().withDetail("message", "Application is ready").build();
        }
        return Health.down().withDetail("message", "Not ready").build();
    }
}

...

// Endpoints are
// http://localhost:8080/actuator/health/startup → Startup probe
// http://localhost:8080/actuator/health/readiness → Readiness probe
// http://localhost:8080/actuator/health/liveness → Liveness probe
6.7. Sample Code – Java MicroProfile health Quarkus
Jakarta 계열의 프레임워크에서는 MicroProfile health를 기반으로 통일성 있는 구현이 가능합니다.
[ ApplicatinState.java ]
package com.example;

import jakarta.enterprise.context.ApplicationScoped;

@ApplicationScoped
public class ApplicationState {
    private volatile boolean isStartingUp = true;
    private volatile boolean isReady = false;

    public boolean isStartingUp() {
        return isStartingUp;
    }

    public void setStartingUp(boolean startingUp) {
        isStartingUp = startingUp;
    }

    public boolean isReady() {
        return isReady;
    }

    public void setReady(boolean ready) {
        isReady = ready;
    }
}

[ StartupHealthCheck.java ]
package com.example;

import org.eclipse.microprofile.health.HealthCheck;
import org.eclipse.microprofile.health.HealthCheckResponse;
import org.eclipse.microprofile.health.Startup;
import jakarta.enterprise.context.ApplicationScoped;
import jakarta.inject.Inject;

@Startup
@ApplicationScoped
public class StartupHealthCheck implements HealthCheck {
    @Inject
    ApplicationState appState;

    @Override
    public HealthCheckResponse call() {
        return appState.isStartingUp()
                ? HealthCheckResponse.down("startup-check")
                : HealthCheckResponse.up("startup-check");
    }
}

[ ReadinessHealthCheck.java ]
package com.example;

import org.eclipse.microprofile.health.HealthCheck;
import org.eclipse.microprofile.health.HealthCheckResponse;
import org.eclipse.microprofile.health.Readiness;
import jakarta.enterprise.context.ApplicationScoped;
import jakarta.inject.Inject;

@Readiness
@ApplicationScoped
public class ReadinessHealthCheck implements HealthCheck {
    @Inject
    ApplicationState appState;

    @Override
    public HealthCheckResponse call() {
        return appState.isReady()
                ? HealthCheckResponse.up("readiness-check")
                : HealthCheckResponse.down("readiness-check");
    }
}

[ LivenessHealthCheck.java ]
package com.example;

import org.eclipse.microprofile.health.HealthCheck;
import org.eclipse.microprofile.health.HealthCheckResponse;
import org.eclipse.microprofile.health.Liveness;
import jakarta.enterprise.context.ApplicationScoped;

@Liveness
@ApplicationScoped
public class LivenessHealthCheck implements HealthCheck {
    @Override
    public HealthCheckResponse call() {
        return HealthCheckResponse.up("liveness-check");
    }
}

...

// Endpoints are
// http://localhost:8080/q/health/started
// http://localhost:8080/q/health/ready
// http://localhost:8080/q/health/live
6.8. Sample Code – C++ httplib
C/C++에서는 httplib를 이용하여 백그라운드 스레드로 Health Check Endpoints를 만들 수 있습니다.
#include "httplib.h"
#include <atomic>
#include <thread>
#include <chrono>

int main() {
    httplib::Server svr;
    std::atomic<bool> ready(false);

    svr.Get("/livez", [](const httplib::Request&, httplib::Response& res) {
        res.status = 200;
        res.set_content("Live", "text/plain");
    });

    svr.Get("/readyz", [&ready](const httplib::Request&, httplib::Response& res) {
        if (ready.load()) {
            res.status = 200;
            res.set_content("Ready", "text/plain");
        }
        else
            res.status = 503;
    });

    svr.Get("/startz", [](const httplib::Request&, httplib::Response& res) {
        res.status = 200;
        res.set_content("Startup complete", "text/plain");
    });

    std::thread([&ready]() {
        std::this_thread::sleep_for(std::chrono::seconds(5));
        ready.store(true);
    }).detach();

    svr.listen("0.0.0.0", 8080);
}
6.9. Container Lifecycle Hook
쿠버네티스에서 Container Lifecycle Hook은 컨테이너의 시작과 종료 시점에 특정 작업을 수행할 수 있도록 지원합니다. 하지만 앱에서 직접 제어할 수 없는 기능에 대해서만 제한적으로 사용하는 것이 좋습니다. 일반적인 Health Check는 앱 내부에서 직접 구현하는 것을 권장합니다.
6.9.1. postStart Hook
실행 방식
- 컨테이너가 시작되면 postStart Hook이 비동기(asynchronous) 방식으로 실행됩니다.
- 즉, postStart 실행 중에도 컨테이너는 이미 트래픽을 수신할 수 있습니다.
- postStart Hook 실행 실패 시 컨테이너는 강제 종료 후 재시작됩니다.
활용 예시
- 컨테이너 시작 시 로그 출력
lifecycle:
  postStart:
    exec:
      command: ["/bin/sh", "-c", "echo 'Container started' >> /var/log/lifecycle.log"]
6.9.2. preStop Hook
실행 방식
preStop Hook은 동기(synchronous) 방식으로 실행됩니다.
- 컨테이너 종료 과정이 preStop 실행 완료를 기다립니다.
- terminationGracePeriodSeconds 이후에는 강제 종료(SIGKILL)가 전송됩니다.
주의점
- preStop과 컨테이너 종료 프로세스가 모두 동기 방식으로 진행되므로 두 과정의 합이 terminationGracePeriodSeconds를 초과하지 않도록 주의해야 합니다.
- preStop에서 실행하는 작업 시간이 길 경우 terminationGracePeriodSeconds를 충분히 늘려줍니다.
terminationGracePeriodSeconds > preStop time + SIGTERM 처리 시간활용 예시 I
- HTTP 요청으로 shutdown 트리거
lifecycle:
  preStop:
    httpGet:
      path: /shutdown
      port: 8080
활용 예시 II
- 프로세스 종료 예시
lifecycle:
  preStop:
    exec:
      command: ["/bin/sh", "-c", "pkill -SIGTERM worker-process && sleep 15"]
6.9.3. Container Termination Process
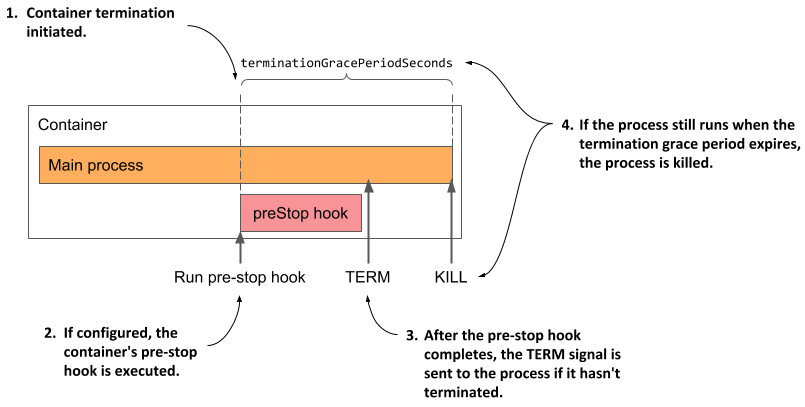
실행 방식
- preStop Hook 실행 후 컨테이너에 SIGTERM이 전송됩니다.
- preStop 여부와 상관없이, terminationGracePeriodSeconds 이후에는 강제 종료(SIGKILL)가 발생합니다.
7. Conclusion
서비스 운영에서 장애는 피할 수 없는 현실입니다. 하지만 Kubernetes의 Health Check를 제대로 활용하면, 장애 발생 시 자동으로 대응하고 서비스의 가용성을 크게 높일 수 있습니다.
특히 모든 서비스와 애플리케이션에서 Health Check 구현 방식을 다시 점검할 필요가 있습니다. 단순히 “동작 중인 것처럼 보이는지”가 아니라, 실제로 트래픽을 안전하게 처리할 수 있는지까지 검증해야 합니다.
이를 위해서는 클라우드개발팀뿐만 아니라 각 유관 개발팀과의 긴밀한 협업이 중요합니다. 모든 서비스를 대상으로 Health Check 전략을 재정비하고, 장애 대응 자동화를 강화한다면 결과적으로 사용자에게 끊김 없는 경험을 제공할 수 있습니다.
결국 Health Check는 선택이 아니라 필수이며, 서비스 가용성을 높이는 가장 기본적인 출발점입니다.
8. References
- Pod Lifecycle
- Kubernetes Readiness Probe: Guide & Examples
- Kubernetes Liveness Probes | Practical Guide | Komodor
- Kubernetes 에서 Pod 에 대한 헬스체크 (probe)
- Kubernetes Health Checks: Ensure Performance and Availability
- [Spring boot] Spring actuator 사용하기 – health check, healthIndicator custom
- Health Check :: Quarkus Tutorial
- Pod Lifecycle
- Container Lifecycle Hooks
- [Kubernetes] Graceful Shutdown – preStop 설정